
Running an online store is a great way to digitise and streamline your business, as it helps with order management, customers being able to shop directly without having to speak to you, fast and secure payments, and a wide customer base to sell to. The Flutterwave Store offers all these benefits and more.
We noticed that many of our Store users asked about the possibility of getting access to basic business data from their dashboards, and of course, we listened. Now, we are excited to introduce Flutterwave Store Analytics to you! 🎉
Store Analytics allows merchants to have an overview and in-depth view of their store’s performance and customer interactions with the store and products. This feature is brought specially to you, to know how well you are really doing and what should be done in the future, to be able to grow as a business owner and as a business.
What can you use each of the Flutterwave Store Analytics features for?
When you want to view your Store stats and compare trends, numbers and make decisions, here are the categories you should look out for:
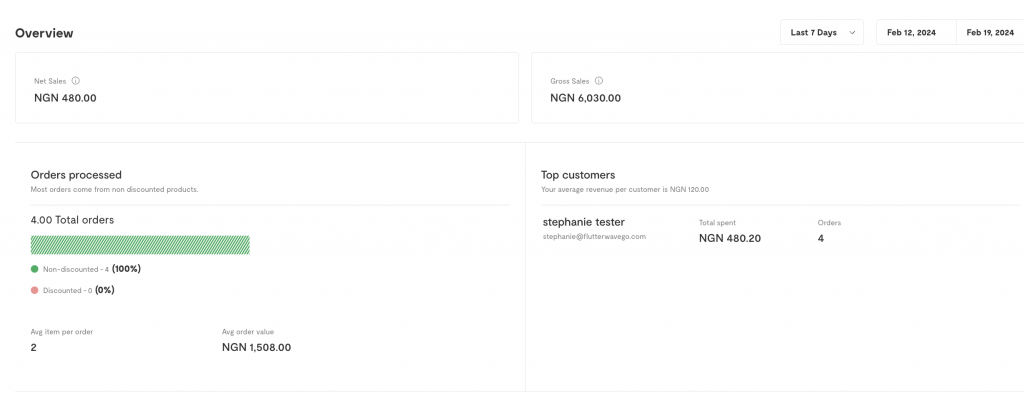
- Top Customer
The top customers that purchased the highest amount of products. In other words, these are your star customers! When looking for specific customers to gift loyalty rewards, discounts and such to, these are the ones to go to first.
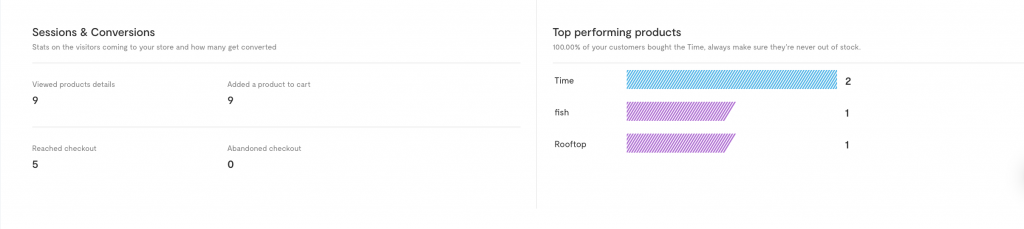
- Top Performing Products
These are the products that customers interact with the most and the products that tend to get purchased the most often. You can push these products more when you are looking to make extra sales.
- Sessions and Conversions
The sessions refer to a few things: the products that have been viewed, added to cart, and abandoned at checkout. On the other hand, conversions refer to how many products that are viewed and added to cart actually reach the checkout stage. You can use this feature to research with your customers why certain products are most often viewed but not purchased.
- Orders Processed
This is the next stage after checkout; the number of orders that are actually completed and paid for. With this, you can also have a view of how many products are typically bought.
- Gross Sales
This is for all sales (calculated by the total of sales price of products multiplied by the quantity ordered) including refunds, coupons and discounts.
- Net Sales
The net sales counts all the gross sales value minus refunds, coupons and discounts.
Additionally, Store owners can view all these statistics for different durations between 1-30 days. So, they can choose how often to view their store’s analytics and analyse its performance.
Why do you need Store Analytics?
Manage and centralise all your data
Store Analytics are useful for managing all your data and keeping it in one place, so that it is easily accessible for you to assess periodically. Being able to continuously monitor your business performance is the first step to making calculated decisions that will improve your business.
Use trends and patterns to identify and solve problems
With analytics, you have access to trends and patterns with your products and customers. Using these trends to monitor your business performance helps you to make better-informed decisions, know what works and what doesn’t and make changes as necessary.
Understand customer behaviour
As a business owner, you can use customer data to understand their behaviour as it relates to your brand and products/services. This in turn helps you customise your content and ads in order to target the right audiences, tailor more specifically and resonate more with them.
Price optimisation
With analytics, you can see how many customers view certain products, and how often too. This will give you an insight to the most popular products, and possibly the products that customers are willing to pay more for. So, analytics can help with optimising prices so that you can increase revenue and profit.
Customer service and satisfaction
By seeing your customers’ trends and behaviours in your store, you can tailor your business offerings and decisions to suit their needs, thus improving your customer service and satisfaction.
How to use Flutterwave Store Analytics
It’s easy for you to get started with Store Analytics from your Flutterwave dashboard. If you don’t have an account yet, you’ll need to create one here.
- Next up, log in to your dashboard.
- On the left-hand panel, click on “Store”.
- From the drop-down menu, click “Overview”.
This will take you to the Analytics page, where you can then view all the statistics at a glance.
Here are the actions by customers that count towards the numbers that will appear on the various cards in the overview:
- Clicking on a product image to view the details
- Adding a product to a cart
- Inputting delivery details and clicking “Place your order”
- If an order is closed at the point of entering payment details, that is an abandoned checkout.
That’s it! Now you have a feature directly from your Flutterwave dashboard where you can view, compare and analyse your store’s performance, and use your findings to make decisions that will grow and scale your business to yours and your customers’ needs. You’re welcome!